 40G/100G Optical Transceivers
 25G Optical Transceivers
 10G Optical Transceivers
 155M/2.5G Optical Transceivers
 1G Optical Transceivers
 1G BIDI Optical Transceivers
 Dual-Rate Optical Transceivers
 FC 16G/32G Optical Transceivers
 CWDM Optical Transceivers
 DWDM Optical Transceivers
 SGMII Port Optical Transceivers
 XFP Optical Transceivers
 100M/1G/10G Coppers
 Full-Rate AOC & Breakout Series
 10G/40G Active DAC Series
 Full-Rate Passive DAC Series
 40G/100G Passive Breakout DAC Series
 Regular/MTP-MPO Fiber Patch Cords
 MT2011
 MT2010
 CodingBox
 QSFP to SFP Adapter
Introduction To Key Parameters Of Optical Module Eye Diagrams
Time: 2019-04-25
1. Formation of Eye Diagrams
An eye diagram is a pattern displayed on an oscilloscope by accumulating a series of digital signals. It is vividly named so because its shape resembles an open eye.
To generate an eye diagram, an oscilloscope needs to measure a large volume of data and then recover the diagram from the measured data. During the eye diagram measurement process, after initial data acquisition, a complete data record can be obtained in the oscilloscope's memory. Then, hardware or software is used to recover or extract the clock to obtain a synchronous clock signal. This clock signal is synchronized with the data in the record on a per-bit basis. Triggered by the recovered clock, signals of multiple UIs (Unit Intervals, equivalent to one clock cycle) captured in the data stream are superimposed—specifically, the data waveforms of each bit are overlapped—finally resulting in an eye diagram.
2. Structure of Eye Diagrams and Introduction to Key Parameters
The key parameters of an eye diagram include: Extinction Ratio, Jitter, Crossing Ratio, Rise Time, Fall Time, and Margin.
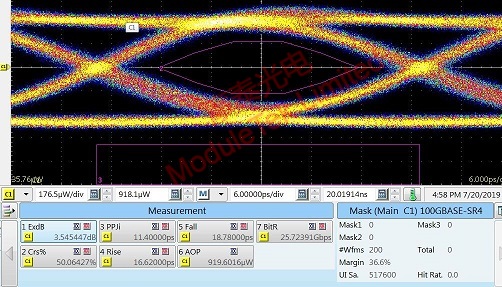
Figure 1 Eye Diagram
2.1 Extinction Ratio
The extinction ratio is defined as the ratio of the power of the "1" level to the power of the "0" level in the eye diagram,the calculation formula is 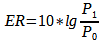 . The requirements for the extinction ratio vary according to different transmission rates, transmission distances, and laser types. It is a crucial parameter in the measurement of optical communication transmitters, as its value determines the quality of communication signals. A larger extinction ratio indicates better logic discrimination capability at the receiver end; conversely, a smaller extinction ratio means the signal is more susceptible to interference, which will lead to an increase in the system bit error rate.
. The requirements for the extinction ratio vary according to different transmission rates, transmission distances, and laser types. It is a crucial parameter in the measurement of optical communication transmitters, as its value determines the quality of communication signals. A larger extinction ratio indicates better logic discrimination capability at the receiver end; conversely, a smaller extinction ratio means the signal is more susceptible to interference, which will lead to an increase in the system bit error rate.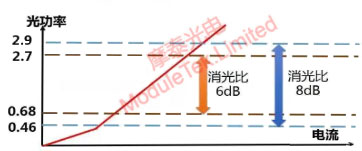
Figure 2 Extinction Ratio
2.2 Jitter
Jitter refers to the horizontal fluctuation of a signal—specifically, the short-term deviation of a signal’s specific timing from its ideal position. It is a type of timing noise that causes bit errors in high-speed data transmission lines. Therefore, it is essential to minimize such jitter in the system to improve overall system performance. The unit of jitter is ps (picoseconds). The jitter observed in the eye diagram can qualitatively reflect the magnitude of signal jitter: the smaller the jitter, the better the signal quality.
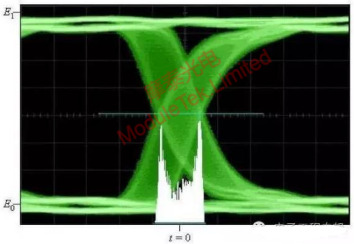
Figure 3 Jitter
2.3 Crossing Ratio
The crossing ratio measures the relationship between the amplitude at the crossing point and the signal levels of "1" and "0". Thus, different crossing ratios can convey different signal level characteristics. In simple terms, the crossing point refers to the area where the two "lids" of the eye diagram intersect, and its ratio reflects the duty cycle of the signal. For a standard signal, the crossing ratio is typically 50%, meaning the "1" and "0" levels each account for half of the signal duration. Variations in the crossing ratio indicate different capabilities of the signal to transmit high-quality "1" or "0" bits.
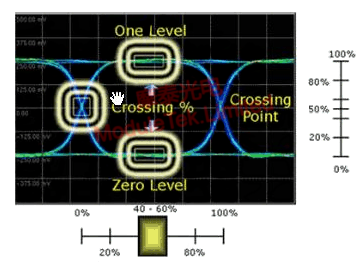
Figure 4 Crossing Ratio
2.4 Rise Time
Rise time is defined as the time interval from the 20% to 80% amplitude point on the rising edge of the eye diagram, which reflects the transition speed of the signal rising edge. Generally, the rise time is required to be no more than 40% of the signal period.
Rise Time (ps) = Average Time at 80% Amplitude Level – Average Time at 20% Amplitude Level
The unit is ps (picoseconds).
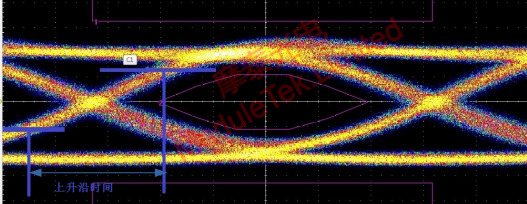
Figure 5 Rise Time
2.5 Fall Time
Fall time is defined as the time interval from the 80% to 20% amplitude point on the falling edge of the eye diagram, which reflects the transition speed of the signal falling edge.
Fall Time (ps) = Average Time at 80% Amplitude Level – Average Time at 20% Amplitude Level
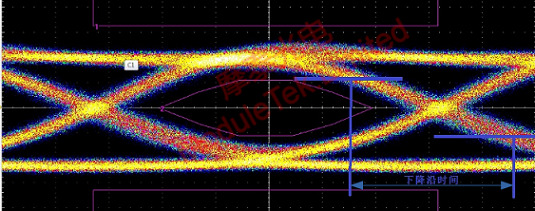
Figure 6 Fall Time
2.6 Eye Mask Margin
The eye diagram margin value represents the expandable range of the edges of the eye mask. It indicates the degree of amplitude opening of the eye diagram at the optimal sampling point. An undistorted eye diagram should have an opening amplitude of 100%. However, in practical scenarios, eye diagrams come in various shapes—some are tall, some short, some wide, some narrow, some fast, some slow—resulting in different margin values. A larger margin value indicates a more standard eye diagram and better signal quality.
Moduletek offers a wide range of optical module products. Welcome to contact us for inquiries and purchases.
For further inquiries about the above content, please contact us at: sales@moduletek.com


